Multiwfn forum
Multiwfn official website: //www.umsyar.com/multiwfn. Multiwfn forum in Chinese: http://bbs.keinsci.com/wfn
You are not logged in.
- Topics: Active | Unanswered
Pages: 1
#1 Re: Multiwfn and wavefunction analysis » Calculate and visualise transition dipole moments » 2022-08-30 15:13:46
Hi there, I did remove the 50-50 keyword and it seemed to be working.
However, I was then confused by the "density" keyword and subsequently the outputs of "transdipmom"
I have submitted 4 jobs using the parameters below for the same td-dft input file (### denotes an abbreviation):
### TD(NStates=10) IOP(2/17=4) ###
### TD(NStates=10, root=1) IOP(2/17=4) ###
### TD(NStates=10, root=2) IOP(2/17=4) ###
### TD(NStates=10, root=3) IOP(2/17=4) ###
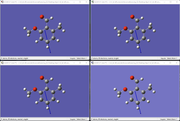
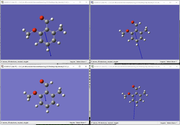
Gaussview was then used to visualise the dipole moments, and the results were identical to the outputs generated by your program, of which the excited states all shared identical dipole moment as of ground state.
Ground state electric dipole moment in X,Y,Z: -339.511661 288.423511 2.281808 a.u.
Transition electric dipole moment between ground state (0) and excited states (a.u.)
i j X Y Z Diff.(eV) Oscil.str
0 1 0.0000000 0.0000000 0.0000000 3.72460 0.00000
0 2 0.0000000 0.0000000 0.0000000 4.23170 0.00000
0 3 0.0000000 0.0000000 0.0000000 5.02000 0.00000
0 4 0.0000000 0.0000000 0.0000000 5.97110 0.00000
0 5 0.0000000 0.0000000 0.0000000 6.44810 0.00000
0 6 0.0000000 0.0000000 0.0000000 6.65840 0.00000
0 7 0.0000000 0.0000000 0.0000000 6.79220 0.00000
0 8 0.0000000 0.0000000 0.0000000 7.20070 0.00000
0 9 0.0000000 0.0000000 0.0000000 7.31220 0.00000
0 10 0.0000000 0.0000000 0.0000000 7.37150 0.00000
However, when I resubmitted these jobs by adding in the "density" keyword (as shown below), the dipole moments looked differently in GaussView, however, Multiwfn still gave the same results as above.
### TD(NStates=10) density IOP(2/17=4) ###
### TD(NStates=10, root=1) density IOP(2/17=4) ###
### TD(NStates=10, root=2) density IOP(2/17=4) ###
### TD(NStates=10, root=3) density IOP(2/17=4) ###
I wonder if there is a way to directly compare/subtract the dipole moment of one output file from another of identical structure (say, Gaussian output file 2 (root=1, density) - Gaussian output file 1) (root=0, density) in Multiwfn.
Thanks again ![]()
#2 Re: Multiwfn and wavefunction analysis » Calculate and visualise transition dipole moments » 2022-08-29 14:18:45
Will give a try now, thanks ![]() I guess then in this case the "root=whatever" would not matter as well.
I guess then in this case the "root=whatever" would not matter as well.
Btw, yosoro!
没想到dalao也是拉拉人hh
#3 Multiwfn and wavefunction analysis » Calculate and visualise transition dipole moments » 2022-08-29 08:42:43
- tdsine
- Replies: 5
Hi,
I would like know how to calculate the transition dipole moment (say S1 - S0) from a Gaussian td-dft output file in Multiwfn, and hence to visualise the transition dipoles (preferably an arrow on the molecule) by combi.
I tried with the example "D-pi-A" given in examples/excit/; in Multiwfn I did 18 -> 5 -> 4 and the output file dipmom looked like this:
Note: The electric dipole moments shown below include both nuclear charge and electronic contributions
Ground state electric dipole moment in X,Y,Z: -0.000011 -0.000006 -0.000013 a.u.
Excited state electric dipole moments (a.u.):
State X Y Z exc.(eV) exc.(nm)
1 -0.000011 -0.000006 -0.000013 3.9069 317.35
2 -0.000011 -0.000006 -0.000013 4.0624 305.20
3 -0.000011 -0.000006 -0.000013 4.4166 280.72
4 -0.000011 -0.000006 -0.000013 4.7912 258.77
5 -0.000011 -0.000006 -0.000013 4.8872 253.69
I then went on to proceed with my td-dft file and I got an error:
Error: This function is unavailable when singlet and triplet excited states are simultaneously occurred
This is my td-dft file input:
%chk=L1.smd.dichloromethane_td-dft.chk
# wB97XD/Def2TZVP SCF=Tight INT(grid=ultrafine) TD(50-50,NStates=10) IOP(2/17=4) SCRF=(SMD,Solvent=dichloromethane)
L1.smd.dichloromethane_td-dft
0 1
C 1.1128330848 -1.2411154091 1.2670908809
C 0.2246856582 -2.2498778555 1.5939734441
...(abbreviated)
Do I need to modify my parameters, say singlet only etc, in order to work this work? Do I also need to specify root and density as well (e.g. TD(50-50,NStates=1, root=4) density)
One step forward, say if we have "dipmom" now, what's the best way to visualise this along side with my xyz structure?
Thanks and cheers.
Pages: 1

