Dear Tian,
thank you very much again.
Best wishes,
Michael
Dear Michael,
It is a bug, I have updated Multiwfn on official site and fixed it.
Best regards,
Tian
Dear Tian,
May I add a quick question?
Using the latest linux version of MultiWFN I have problems with the atom_moment.txt file generated in AIM basins. The file is empty. The procedure I use is the following:
Loading the orca molden file
17,1,1,4,8
then answering "y"
This produces two files "multipole.txt" and "atom_moment.txt". The first one looks like the file generated from fuzzy atom analysis, but the second file is empty. Could you point me to my error?
Thanks,
Michael
Dear Tian,
Thank you very much for the implementation. I already tried it out on a few examples and it works flawlessly. I am grateful to you for adding this functionality so quickly to MultiWFN.
Best wishes,
Michael
Dear Michael,
I am glad to inform you that atomic dipole moment and quadrupole moment calculated by Multiwfn now can be very easily and perfectly visualized in VMD program!
Please check Section 4.15.5 of latest version of Multiwfn manual for details and examples.
Best,
Tian
Dear Michael,
I will implement this feature recently, when it is finished, I will let you know here.
Best,
Tian
Dear Tian,
Thank you for your reply. This would indeed be very valuable!
Kind regards,
Michael
Dear Michael,
I think plotting such a map should be useful to graphically portray Q tensor, do you think so? It should be possible to realize in Multiwfn when I have spare time.
Best regards,
Tian
If such a visualisation is not feasible, then calculating the eigenvectors of the Q tensor and exporting these as three Xe atoms would be great. With the help of this the form of the tensor (prolate vs. oblate) could be discerned.
Thank you in advance,
Michael
Hello Tian,
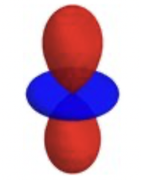
thanks to your efforts it is possible to calculate atomic multipole moments based on the fuzzy atom approach. I was wondering, if there is an easy way to visualise the results. In principle if one looks at the ration of Q_xx/Q_zz one can plot a quadrupole moment distribution. For Q_xx/Q_zz = 0.5, this would look something like the attached figure.
In the extreme of Q_xx being larger than Q_zz the graph would be rotated by 90° and the colours switched. Visualisation would be fairly straightforward, if the atom of interest was in the centre and the molecule suitably aligned... Alas that is almost never the case. Could you add a function, whereby one could create an isosurface of the quadrupole moment distribution of an atom in a molecule? I think this would be extremely helpful.
Best wishes,
Michael


