Thank you Dr Lu for quick reply and for the literature.
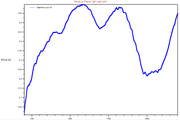
I have obtained below given diagram. Is it ok?
Best wishes,
Alisher
It looks normal
Thank you Dr Lu for quick reply and for the literature.
I have obtained below given diagram. Is it ok?
Best wishes,
Alisher
Dear Alisher,
Load the trajectory file into VMD, enter "Extensions" - "Analysis" - "RMSD Trajectory Tool". Input "all" at the upper left text box, then click "Align" button to remove overall translation and rotation, then select "Plot" check box, and finally click "RMSD" button, the RMSD curve will be shown.
RDF curve and power spectrum are useless for this study.
PS: It is worth to mention that recently I proposed a novel way of characterizing molecular planarity, and it has been employed to investigate evoluation of planarity of C18 over the whole dynamics trajectory. See Journal of Molecular Modeling (2021) 27:263 https://doi.org/10.1007/s00894-021-04884-0 for detail, and see section 4.100.21.3 of latest version of Multiwfn manual for example. This new analysis method provides complementary information to RMSD analysis for many systems.
Best regards,
Tian
Dear Dr. Lu,
Thank you for the excellent work: 10.26434/chemrxiv.11320130.v2
I tried AIMD calculation in ORCA. I would like to get RMSD vs TimeStep diagram using VMD. However, it doesn't work in my case. Please share your experience. Why didn't you include RDF g (r) and power spectrum in your article? Is it possible to get them from the trajectory file of the ORCA program?
Thank you in advance,
Alisher
